Slow dashboards are a business problem, not just an annoying one. If your charts are pulling stale numbers, you’re making decisions based on data that’s already out of date, and by the time someone builds you a “real” dashboard, the moment to act on it has often passed. That’s the exact pain point behind this Dashtera review — a no-code, GPU-accelerated dashboard builder that promises real-time data visualization without needing a developer on standby.
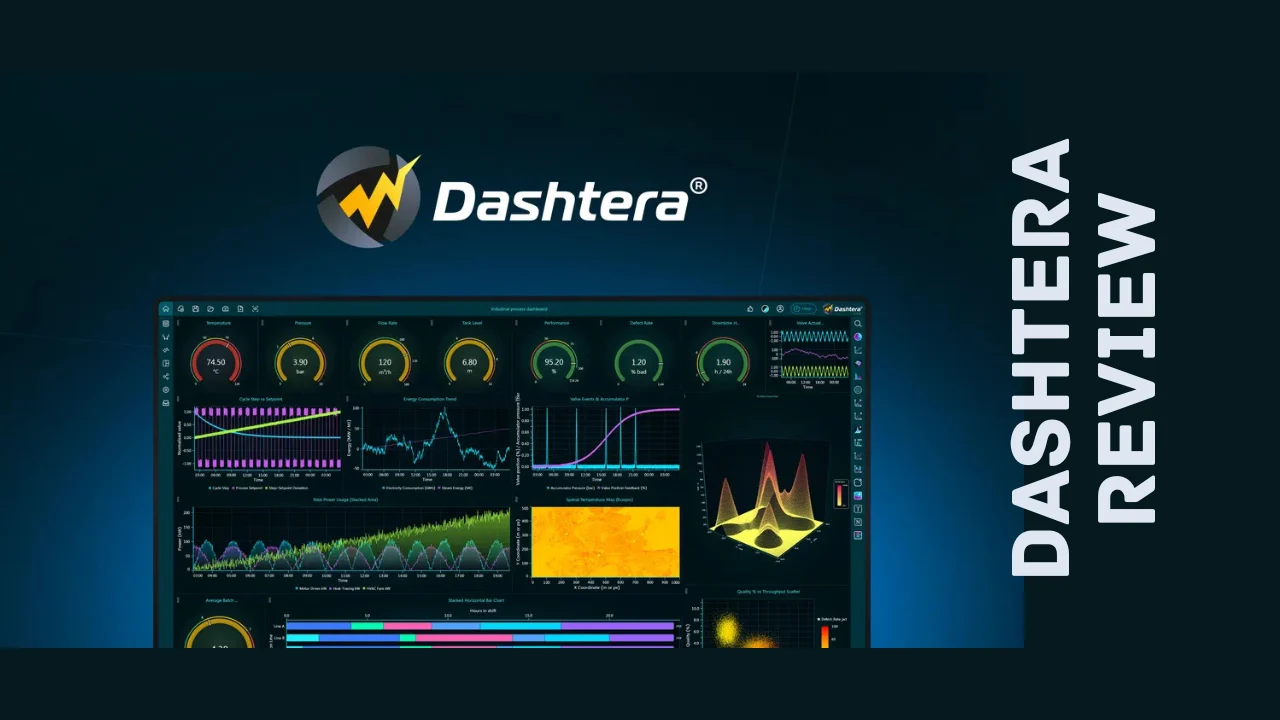
Dashtera connects to your databases, spreadsheets, and streaming data sources, then turns all of it into interactive dashboards using drag-and-drop tools instead of code. It’s built for data analysts, business intelligence teams, researchers, engineers, and — increasingly — small business owners and marketers who just want a live view of their numbers without waiting on IT.
This review covers what Dashtera actually does, how the pricing breaks down, how it performs day-to-day, and how it stacks up against heavyweight tools like Tableau and Grafana.
Overview of Dashtera
Dashtera comes from LightningChart, a Finland-based company that’s been building high-performance, GPU-accelerated data visualization technology since 2007. That’s nearly two decades of experience powering software used in demanding environments like defense systems, industrial production lines, advanced engineering platforms, and financial trading tools, with clients that reportedly include organizations like Tesla, the U.S. Army, Raytheon, and Lloyds Banking Group.
Dashtera itself is the newer, no-code layer built on top of that engine, officially launched in 2026 out of Kuopio, Finland. The mission is straightforward: take the same rendering power used in mission-critical engineering software and make it accessible to people who don’t write code. Instead of down-sampling data or slowing down as datasets grow, Dashtera is built to visualize massive, fast-moving datasets — reportedly up to 100 million data points per dashboard — directly in the browser.
The target audience spans a wide range: business intelligence teams monitoring company KPIs, engineers and scientists tracking sensor or experiment data, finance professionals watching live market feeds, and small business owners or marketers who want a real-time view of performance metrics without hiring a dedicated data engineer.
Key Features
Dashtera’s feature list leans heavily into performance and flexibility, which makes sense given the engineering background behind it. Here’s what stands out among Dashtera’s features:
- No-code, drag-and-drop dashboard builder for designing and arranging charts without writing queries
- GPU-accelerated rendering powered by WebGL, built to handle large and fast-moving datasets smoothly in the browser
- 90+ chart types, including basic, XY, 3D, bar, and polar charts, plus KPI panels and statistics charts for quick scanning
- Interactive WebGL maps for visualizing geographic and location-based data
- Real-time streaming support, connecting to sources like WebSocket, Redis, Cassandra, Trino, Snowflake, and InfluxDB
- SQL and NoSQL database connectors, including PostgreSQL, MySQL, SQL Server, MongoDB, and MariaDB
- File-based data import from CSV, JSON, XML, and Excel files
- Financial and trading tools, including candlestick charts, 100+ technical indicators, and 30+ drawing tools
- Drill-down and drill-through navigation, letting you move from a high-level view straight into individual records
- Engineering and science visualizations, including 3D surface, scatter, and elevation charts for complex datasets
- Data filtering, grouping, and aggregation, plus support for custom formulas and transformations inside dashboards
- Export and sharing options, including PDF reports, PNG exports, and shareable dashboard links
- Independent cybersecurity audit, aimed at validating the platform for regulated and security-sensitive industries
That’s a genuinely broad range of capability for a no-code tool, and it’s clear the underlying rendering engine is doing a lot of heavy lifting compared to typical drag-and-drop dashboard builders.
Ease of Use & User Experience
Getting started with Dashtera follows a familiar no-code pattern: connect a data source, drag chart components onto a canvas, and arrange them into a dashboard. Because there’s no coding required, most users should be able to get a basic dashboard up within their first session, and the drag-and-drop editor keeps the learning curve reasonable even for people who’ve never touched a BI tool before.
The interface runs entirely in the browser, so there’s no software to install, and dashboards render using GPU acceleration rather than relying on the browser’s default rendering, which is what allows Dashtera to stay responsive even with large or fast-updating datasets. That’s a meaningful difference if you’ve ever watched a spreadsheet or a lightweight BI tool choke on a big dataset.
Because Dashtera only recently launched, there isn’t yet a long history of day-to-day usability feedback the way there is for more established BI tools. Early impressions point to a clean, focused interface built more for functionality than flash, which tends to suit data-heavy users well but may feel slightly less polished than tools that have had years to refine their onboarding flow. Dashboard building is best done on a desktop given the density of options involved, though viewing finished dashboards works fine on mobile browsers.
Dashtera Pricing Breakdown
Dashtera is available as a one-time payment for lifetime access, rather than the recurring monthly or annual subscription you’d typically pay for enterprise BI tools like Tableau. That structure alone is a major part of what makes this Dashtera review worth reading if you’re comparing long-term costs against subscription-based competitors, since a single upfront payment can save real money over a few years of BI software subscriptions.
All three tiers include unlimited charts and dashboards, business intelligence and engineering chart types, CSV/JSON/XML/Excel data import, SQL and NoSQL database access, polar charting, 100+ technical indicators, 30+ drawing tools, and advanced sharing options. What changes between tiers is storage, data point capacity, the number of active data connectors, and the depth of XY and 3D charting.
| What’s Included | Tier 1 | Tier 2 (Most Popular) | Tier 3 |
|---|---|---|---|
| Price | $59 (regular $199) | $149 (regular $399) | $299 (regular $599) |
| Access | Lifetime access | Lifetime access | Lifetime access |
| Storage limit | 500 MB | 750 MB | 1 GB |
| Charts & dashboards | Unlimited | Unlimited | Unlimited |
| Data points | 100,000 | 500,000 | 1,000,000 |
| Active data connectors | 3 | 4 | 5 |
| XY charting | Basic | Advanced | Advanced |
| 3D charting | Basic | Advanced | Advanced |
| Refund window | 60 days | 60 days | 60 days |
Every tier is backed by a 60-day refund window, so you can build a real dashboard against your own data before deciding whether to keep it. Dashtera’s standard site also offers a free plan for people who want to test the basics before committing to a paid tier, though the lifetime pricing above is where the real value sits if you’re planning to use the tool long-term.
For most solopreneurs, marketers, and small business owners tracking core KPIs, Tier 1 or Tier 2 should cover typical needs. Teams working with larger datasets, more data sources, or advanced 3D visualization for engineering or scientific work will get more mileage out of Tier 3. Either way, Dashtera pricing lands well within range for anyone comparing it against typical monthly BI software costs, making it one of the more affordable software options for teams that want real-time dashboards without an ongoing bill.
Pros and Cons
| Pros | Cons |
|---|---|
| One-time lifetime payment instead of a recurring subscription | Entry tier caps storage and data points fairly low |
| GPU-accelerated rendering handles large, fast-moving datasets smoothly | Newer product with limited long-term usability track record |
| 90+ chart types across BI, engineering, and finance use cases | Advanced 3D and XY charting locked behind higher tiers |
| No-code drag-and-drop builder, no developer required | Only 3–5 active data connectors depending on tier |
| Backed by nearly two decades of visualization engineering experience | Smaller community and fewer tutorials than established BI tools |
| Strong data connector list, including SQL, NoSQL, and streaming sources | Very limited independent review volume so far |
| 60-day refund window on every tier | Mobile experience is better for viewing than building dashboards |
Who Should Use It?
Dashtera is a strong fit if you fall into one of these groups:
- Small business owners and marketers who want a live view of sales, traffic, or campaign metrics without hiring a data engineer
- Data analysts and business intelligence teams who need fast, no-code dashboards without waiting on development cycles
- Engineers and researchers working with sensor data, IoT telemetry, or scientific datasets that need 3D and real-time visualization
- Finance and trading enthusiasts who want candlestick charts, technical indicators, and live price feeds in one dashboard
- Founders and consultants who need to present live data to clients or stakeholders without building custom reporting tools
It’s less of a fit if your reporting needs are extremely simple, like a single static monthly chart, where a spreadsheet would do the job just fine. But for anyone dealing with data that changes by the hour or the second, Dashtera is built exactly for that problem, and it holds up as one of the more capable productivity tools for entrepreneurs who need to actually see what’s happening in their business in real time.
Comparison With Competitors
| Feature | Dashtera | Tableau | Grafana |
|---|---|---|---|
| Pricing model | One-time lifetime payment | Monthly/annual subscription per user | Free open-source tier, paid cloud plans |
| No-code dashboard builder | Yes | Yes | Partial (some technical setup required) |
| GPU-accelerated rendering | Yes | No | No |
| Real-time streaming data support | Yes | Limited | Yes |
| 3D and engineering-focused charts | Yes | No | No |
| Financial/trading chart types | Yes (candlesticks, indicators) | Limited | Limited (via plugins) |
| Best for | Real-time, large-dataset dashboards | Enterprise BI and reporting | DevOps and infrastructure monitoring |
Tableau remains one of the most established names in business intelligence, with a mature ecosystem and deep enterprise features, but it comes with per-user subscription pricing that adds up fast for small teams. Grafana is a favorite among engineering and DevOps teams for real-time monitoring, and it’s free to self-host, but it leans more technical to set up and isn’t built with financial or general business dashboards in mind. If you’re weighing Dashtera alternatives, the honest takeaway is that Tableau wins on ecosystem maturity and Grafana wins on infrastructure monitoring, while Dashtera’s advantage is combining no-code simplicity with genuinely fast rendering at a one-time price.
User Feedback Summary
Because Dashtera only launched in 2026, it doesn’t yet have the review volume you’d find for an established BI tool across major software review platforms, and there simply hasn’t been enough time for a large, independent sample of user feedback to build up on sites like G2, Capterra, or Trustpilot. That’s worth being upfront about rather than overselling early sentiment as if it were years of proven data.
What early feedback exists has been positive, and it lines up with what you’d expect from a tool built on a visualization engine that’s been refined since 2007. Users highlight the speed of the rendering engine when working with larger datasets, along with how quickly a basic dashboard can be built without any coding background. The backing from LightningChart’s enterprise track record also gives buyers more confidence than a typical first-time software launch would.
The realistic read here is that Dashtera looks promising based on its technology and early impressions, but anyone buying should treat it as an early-adopter opportunity rather than a tool with a decade of proven public reviews behind it. For a fast-moving, actively developed product, that trade-off is often worth it if the core features already match what you need.
Frequently Asked Questions
What is Dashtera used for?
Dashtera is a no-code dashboard and data visualization platform that connects to databases, spreadsheets, and real-time streaming sources to build interactive dashboards. It’s used for business intelligence, financial and trading analysis, engineering and scientific data monitoring, and general performance tracking, all without requiring any coding.
Is Dashtera a one-time payment or a subscription?
Dashtera is currently available as a one-time lifetime payment across three pricing tiers, rather than a recurring monthly subscription. Each tier includes unlimited dashboards, with storage, data point capacity, and connector limits increasing at higher tiers, all backed by a 60-day refund window.
Does Dashtera support real-time data?
Yes, real-time data is one of Dashtera’s core strengths. It connects to streaming sources like WebSocket, Redis, and InfluxDB, and uses GPU-accelerated rendering to keep dashboards responsive even as data updates continuously, which is a common weak point for many traditional dashboard tools.
How is Dashtera different from Tableau or Grafana?
Dashtera combines a no-code dashboard builder with GPU-accelerated rendering built for large, fast-moving datasets, and it’s priced as a one-time payment instead of a subscription. Tableau focuses on enterprise BI with per-user pricing, while Grafana is built more for technical infrastructure monitoring, making Dashtera a middle ground for teams wanting simplicity and speed.
Can Dashtera handle large datasets?
Yes, Dashtera is built specifically for large and high-frequency datasets, with reported capacity up to 100 million data points per dashboard depending on your setup. This is possible because of the GPU-accelerated rendering engine behind the platform, which avoids the slowdown typically seen in browser-based dashboard tools.
What data sources does Dashtera connect to?
Dashtera connects to SQL databases like PostgreSQL, MySQL, and SQL Server, NoSQL databases like MongoDB and MariaDB, and streaming sources like WebSocket, Redis, and InfluxDB. It also supports file-based imports from CSV, JSON, XML, and Excel for teams working with static exports or spreadsheets.
Is Dashtera good for small businesses?
Dashtera works well for small businesses that want real-time visibility into sales, traffic, or operational metrics without hiring a developer. Combined with its one-time payment structure, it counts as one of the more affordable software options for small teams that would otherwise pay ongoing subscription fees for a comparable BI tool.
Does Dashtera offer a free trial or refund policy?
Dashtera’s standard site offers a free plan for testing the basics, and every lifetime pricing tier includes a 60-day refund window. That gives buyers real time to connect their own data, build an actual dashboard, and confirm the platform fits their workflow before the refund period closes.
Final Verdict
Wrapping up this Dashtera review, the platform earns a solid recommendation for anyone who needs real-time, no-code dashboards without paying enterprise BI pricing. The GPU-accelerated engine genuinely sets it apart from typical drag-and-drop dashboard tools, and having nearly two decades of visualization engineering behind the product adds a level of credibility that most brand-new SaaS launches simply don’t have.
It’s not a perfect fit for everyone. The entry tier’s storage and data point limits are modest, and as a newer product, it hasn’t built up years of public review history yet. But for small business owners, marketers, analysts, and engineers who need fast, real-time dashboards without hiring a developer or paying a recurring BI subscription, Dashtera delivers real value at a one-time price, and it’s well worth testing against your own data before committing to a pricier, subscription-based alternative.